From data to decisions: FacilityApps BI module now available with AI support

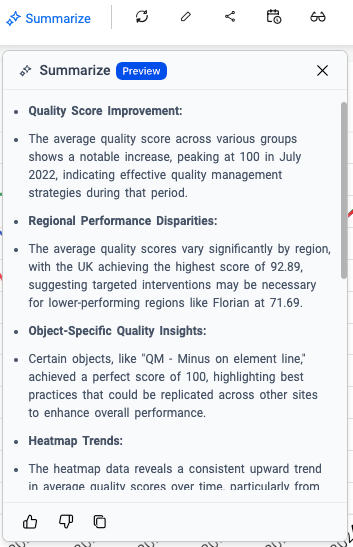
AI summarize – Instant management summary
As soon as you open a dashboard, you’ll now see the Summarize button. With one click, AI analyzes the underlying data and automatically generates a clear management summary, including:
- Trends and anomalies
- Expected developments
- Concrete recommendations
For managers, this means no more endless clicking or interpreting data—just immediate insight and context. Ideal for management meetings, client discussions, or internal evaluations.
Important: this AI functionality runs entirely on our own servers. Data never leaves the FacilityApps platform.
The AI Summarize feature is currently in beta and available free of charge for now.
AI agent – Simply ask your data
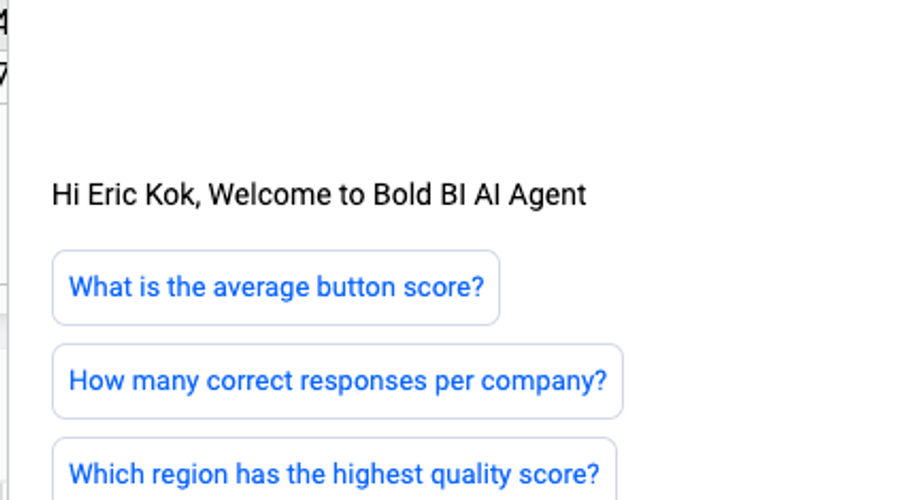
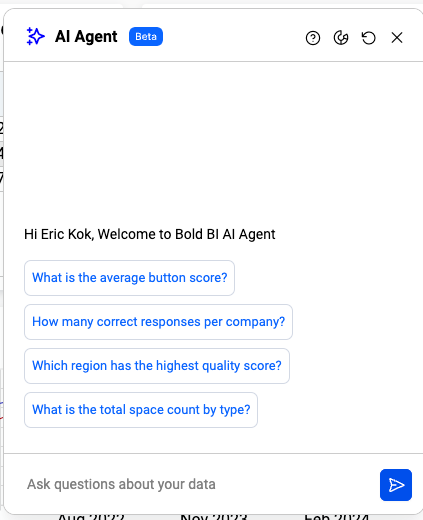
In the bottom-right corner of the dashboard, you’ll find the new AI agent. This allows you to ask questions in plain language, such as:
- “Where are costs increasing the most this month?”
- “Show me an overview of productivity per location”
What makes this unique is that the AI doesn’t just provide answers, it also automatically builds widgets and visualizations.
In the Dashboard designer, the AI also helps with:
- Creating widgets
- Styling (colors, fonts, conditional formatting)
- Designing professional dashboards faster
For organizations without a BI specialist, this significantly lowers the barrier to entry.
Better collaboration and international use
Version comments for dashboards
Dashboard Designers can now add comments with each publication. These are visible in the version history and ensure:
- Clear documentation of changes
- Better collaboration within teams
- More control and transparency
This is a major improvement, especially for larger cleaning organizations or international teams.
Dynamic language selection
Dashboards can now be easily configured to support multiple languages. Users can select their preferred language via a dropdown within the dashboard.
This makes our BI module highly suitable for:
- International cleaning companies
- Multilingual teams
- Client reports in the customer’s own language
More professional dashboards, better exports
Consistent layouts on every device
With Fixed Layout Support, dashboards look the same everywhere on laptops, tablets, or large screens. No more shifting charts.
PowerPoint & Excel export
- Export complete dashboards or individual widgets to PowerPoint
- Improved Excel export, including large datasets
- Hyperlinks remain intact, including leading zeros
Perfect for reports to clients, boards, and tenders.
Smart navigation between dashboards
Button widgets & cross-dashboard filters
New button widgets make it possible to logically connect dashboards. Filters (such as location, period, or department) are automatically carried over.
Examples:
- Drill down from a management overview to detailed information per location
- Navigate directly from KPIs to underlying documentation or PDFs
This makes BI not only insightful, but also intuitive and action-oriented.
More powerful widgets and better performance
We’ve improved nearly all widgets, including:
- Grid widgets with column dragging, copy (Ctrl+C), and row-level links
- Tree maps with improved labeling
- Advanced filter options
- More control over legends, axes, and theming
- Faster performance, especially with large datasets
The result: dashboards that are not only more attractive, but also faster and more pleasant to work with.
What does this mean for cleaning companies?
With this release, the FacilityApps BI module is:
- More accessible – thanks to AI and natural language
- More international – with dynamic translations
- More professional – with improved layouts and exports
- More action-driven – through smart navigation and AI insights
Whether you want to manage quality, costs, productivity, or sustainability, our BI solution helps you make better decisions faster without complexity.
Curious to see what this looks like in your organization? We’d be happy to show you in a demo.
Related posts
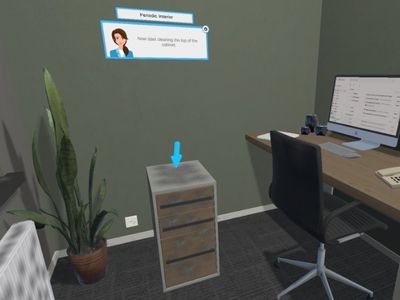
Cleaning Workx, powered by FacilityApps, launches new 'Periodic Cleaning' training modules
Cleaning Workx introduces the Periodic Interior and Periodic Sanitary modules — the most requested addition among existing customers. Available immediately in 18 languages as part of the core platform.
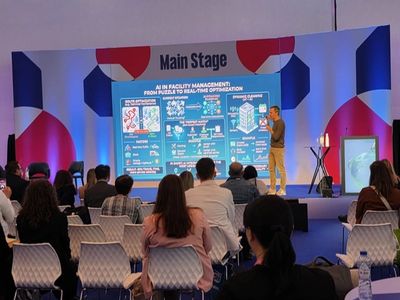
From invisible to intelligent: the cleaning industry must shape its own AI future
A manifesto for the cleaning industry: will we be passive recipients of AI disruption, or active architects of our own transformation? CEO Dirk Tuip wrote a manifesto for the next decade.

Digitise your workflows with the new multi-step forms
New in FacilityApps: multi-step forms. One form goes through multiple roles and stages, while all information is stored centrally. No loose papers, no lost emails - just a fast, transparent workflow.